
What is a Pub/Sub architecture 💬 ?
How to implement it for monitoring your data flows ?

Disclaimer: This article is not intended for technical purposes. As I am not a data engineer, I may not be able to provide you with a use case that you can replicate on your own. However, it is worth understanding what is at stake and how such a project could leverage the data pipeline workflow of your team. To keep it simple, we will not tackle the CI/CD part (Continuous Integration/Continuous Delivery or Development) that you would need if you were to implement such a project for professional purposes.
Nevertheless, some tutorials are available throughout the article for you to familiarize yourself with Pub/Sub.
What you will learn in today’s edition of STACK :
What does Pub/Sub stand for ? 🤔
1.1 Why implement Pub/Sub Messaging to monitor your Data Streams?
Pub/Sub for Monitoring: how does it work? 🖥
2.1 Adaptation of Pub/Sub Core Concepts to Monitoring Usage
2.2 Model of Pub/Sub Architecture for Monitoring
Pub/Sub for Data Alerting 🚨
3.1 Seizing the Right Alerting Goals 🎯
1. What Does Pub/Sub Stand For? 🤔
Pub/Sub stands for Publisher and Subscriber. It is an asynchronous and scalable messaging service that decouples services producing messages from services processing those messages. In this case, we will focus on the Pub/Sub messaging for Monitoring Data Jobs running on a schedule.
1.1 Why implement Pub/sub Messaging for Monitoring your Data Streams? 💬
As there are multiple uses of Pub/Sub architecture, we will only cover Monitoring and Alerting, which you will likely use the most as a Data Engineer.
Going back to basics, all automated data pipelines designed for analytics may fail at one time or another, for various reasons and on different technologies. Each case is unique, and the more jobs running on schedule, the more often errors are likely to occur. If you have to review on a daily basis which job is crashing and for what reason in the UI interface of each ETL (Extract Transform Load), it can quickly become overwhelming and time-consuming.
I know that sometimes it might be confusing not to see the big picture 🤔:
Here is a macro view of the different steps data goes through from top to bottom before being analyzed. As a pipeline encompasses all these steps, Pub/sub-streaming should monitor the application that organizes these steps.
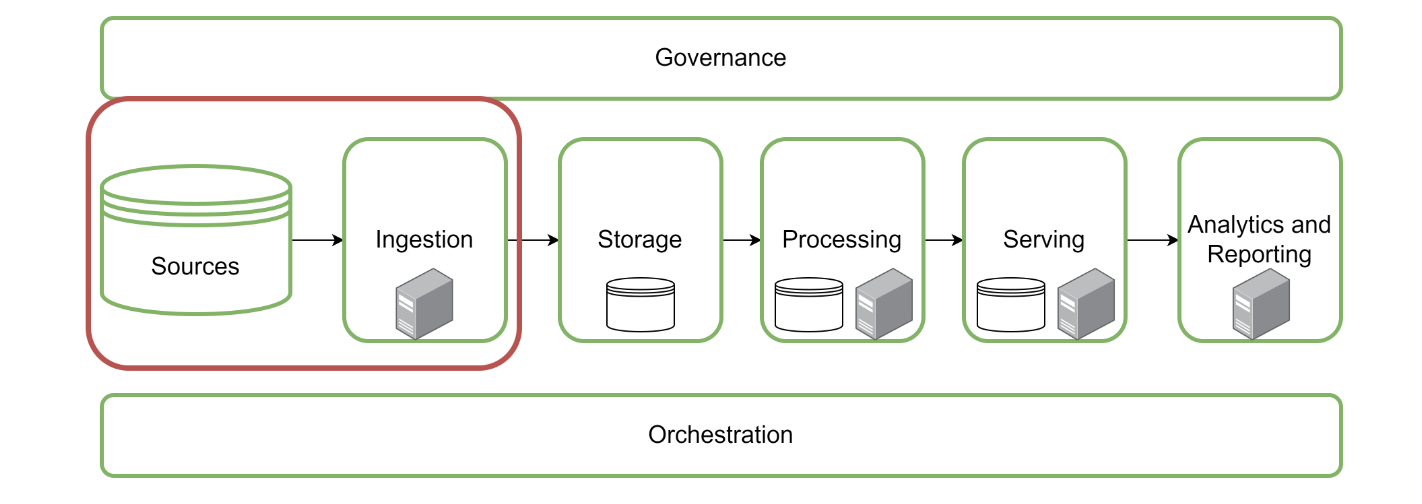
Source : DataCamp, Database Engineering
That is why creating a streaming data platform improves the quality of maintenance and efficiency in fixing your bug errors while everything is constantly changing. With Pub/Sub messaging, you can track and expose data loading processes' statuses from top to bottom.
As a use case, every ETL/ELT (Extract Load Transform) system you are using for running your jobs does have a pub/sub API for monitoring data streams. It might have several, one for each function used, for instance in Azure, like Function Apps and Logic Apps if you are familiar with the product.
How Does It Work Schematically?
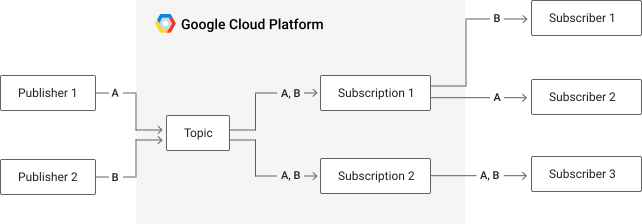
Source: Pub/Sub documentation
Core Concepts of Pub/Sub Messaging
In this case, a topic can be a network latency, for instance. It is a named entity that represents a feed of messages. The message is the data that moves through the service from a Publisher (in our case, the loading app) to a Subscriber (us). Regarding the topic, the Pub/Sub architecture is highly scalable and highly adaptable to a wide range of topics.
In our case, the Pub/Sub APIs are gathering the following information:
Identifier of the Published Message
Timestamp of the Published Message
Status of the Published Message
Content of the Message (often JSON response)
2. Pub/Sub for Monitoring 🖥
2.1 Adaptation of Pub/Sub Core Concepts to Monitoring Usage 🛣
If you are not familiar with the architecture, don't panic; I will explain it step by step with a hands-on example you might use for monitoring ETL Data Pipelines.
When creating a Pub/Sub architecture for monitoring our data streams, the information can include (non-exhaustive and depends on which native field is included in the APIs responses):
Identifier of the Published Message
Identifier of the Job
Application Used
Status (Success, Fail, or Warning)
Timestamp of the Published Message
Timestamp when the job started
Timestamp when the job ended
JSON response of the failure
All these fields mentioned above are included in the events table we would like to build.
2.2 Model of Pub/Sub Architecture for Monitoring 👷🏻
This schema gives us a global point of view of how the architecture will be designed regarding three blocks:
The Pipeline Block represents a data flow with ETL (Extract Load Transform) operations.
The second one is the pub/sub-function, which monitors every application by gathering created events with their status and then storing them into a table.
Finally, all come into a nice and polished dashboard your users (data engineers) will interact with for their daily checks.
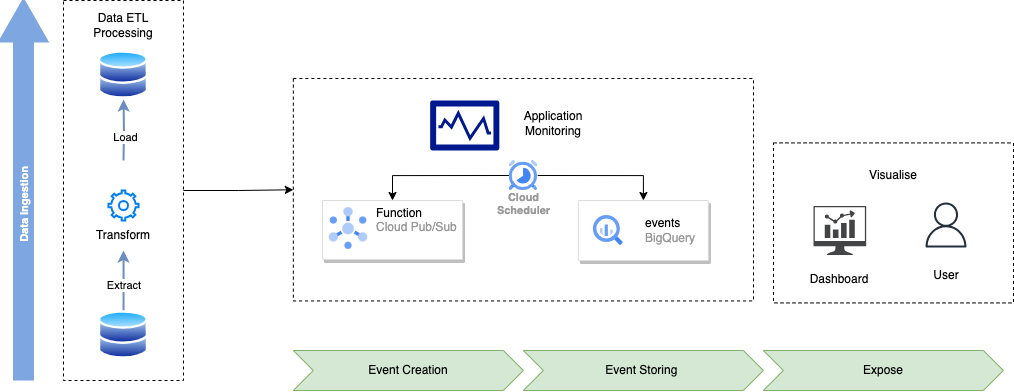
As you might guess, it requires publishing events coming from different data sources under standardized fields. For this purpose, Cloud Pub/Sub function is orchestrating data collecting from the different API event statuses in every ETL monitored in the project. Then you should be able to obtain a table as an output containing all these events.
If you are wondering what Cloud Pub/Sub function is in detail, I'll let you discover the documentation following below:
Both Cloud Function and Events Table are refreshed in this model by a cloud scheduler. It is a simple module automating refresh.
3. Pub/Sub for Data Alerting 🚨
3.1 Seizing the Right Alerting Goals 🎯
Pub/Sub for Data Monitoring is the first and typical use of this architecture. However, it could be replicated as well for Data Alerting. Data Alerting is the advanced version you can achieve monitoring with.
Two things should be considered before defining alerting topics on your SLIs (Service Level Indicators):
Relevance of what we are monitoring to our business goals
The intended outcome once we notify someone there's an issue
These alerts can be sorted into three categories:
Availability: server-side connection, third-party API request
Latency: fast (for us humans)
Integrity/durability: data should always be safe and secured.
What type of alerting do you want to implement?
With this said, alerting uses the same architecture as monitoring but with slight changes to topics. As we want to monitor each time a job is failing or going to fail while executing for too long, an alert should be designed for such a purpose as a typology of errors. Regarding your data architecture and the system you are monitoring, these typologies can greatly differ from one another. That is why, here are a few questions to ask yourself before tackling SLIs:
Do I want to sort types of recurring issues into categories? Which ones?
Among jobs in failure, how do I define a priority to solve each regarding how critical the job is?
Are there specific recurring issues already identified by your team on one tool? For example, one job is not in success, not in failure, but still running indefinitely. How can I implement an SQL test for checking between two dataset refreshes that the same job has the same status executing twice?
For a deeper dive into this topic, check this article which explains a hands-on tutorial to build an alerting tool with a GCP ETL: Building Efficient Event-Driven ETL Processes on Google Cloud: Best Practices
Conclusion
I hope you are now starting to get an overview of the opportunities offered by Pub/Sub architecture for monitoring all your data streams. I advise you to go through the basics and a few tutorials before starting to implement it for your real-time data projects.
By decoupling data producers from data consumers and providing asynchronous communication, Pub/Sub messaging has become a fundamental building block for real-time data processing, event-driven architectures, and seamless monitoring. This architectural pattern enables teams to stay on top of their data pipelines, react swiftly to issues, and ensure the smooth operation of their systems.
Whether you're dealing with IoT data, financial market updates, or any other data-intensive application, Pub/Sub architecture can be adapted to fit your needs. It empowers organizations to efficiently track data flows, detect anomalies, and improve overall data pipeline reliability.
As you venture into the world of Pub/Sub architecture, it's essential to explore the basics and dive into tutorials that align with your specific use case. Understanding the core concepts and best practices will pave the way for implementing this architecture successfully in your real-time data projects.
👉 Tell me in the comments if you want me to publish a tutorial for writing your first pub-sub data flow